At 10:07 on a Tuesday morning, our support inbox started filling with a familiar complaint: “The Save button is broken.” It was not broken. It was just late.
The dashboard team had shipped a harmless-looking release the night before: a few richer filters, one additional chart, and some extra analytics events. CPU stayed fine in synthetic checks, error rates were clean, and backend latency barely moved. But user behavior changed immediately. People clicked Save twice. Then three times. Then abandoned drafts.
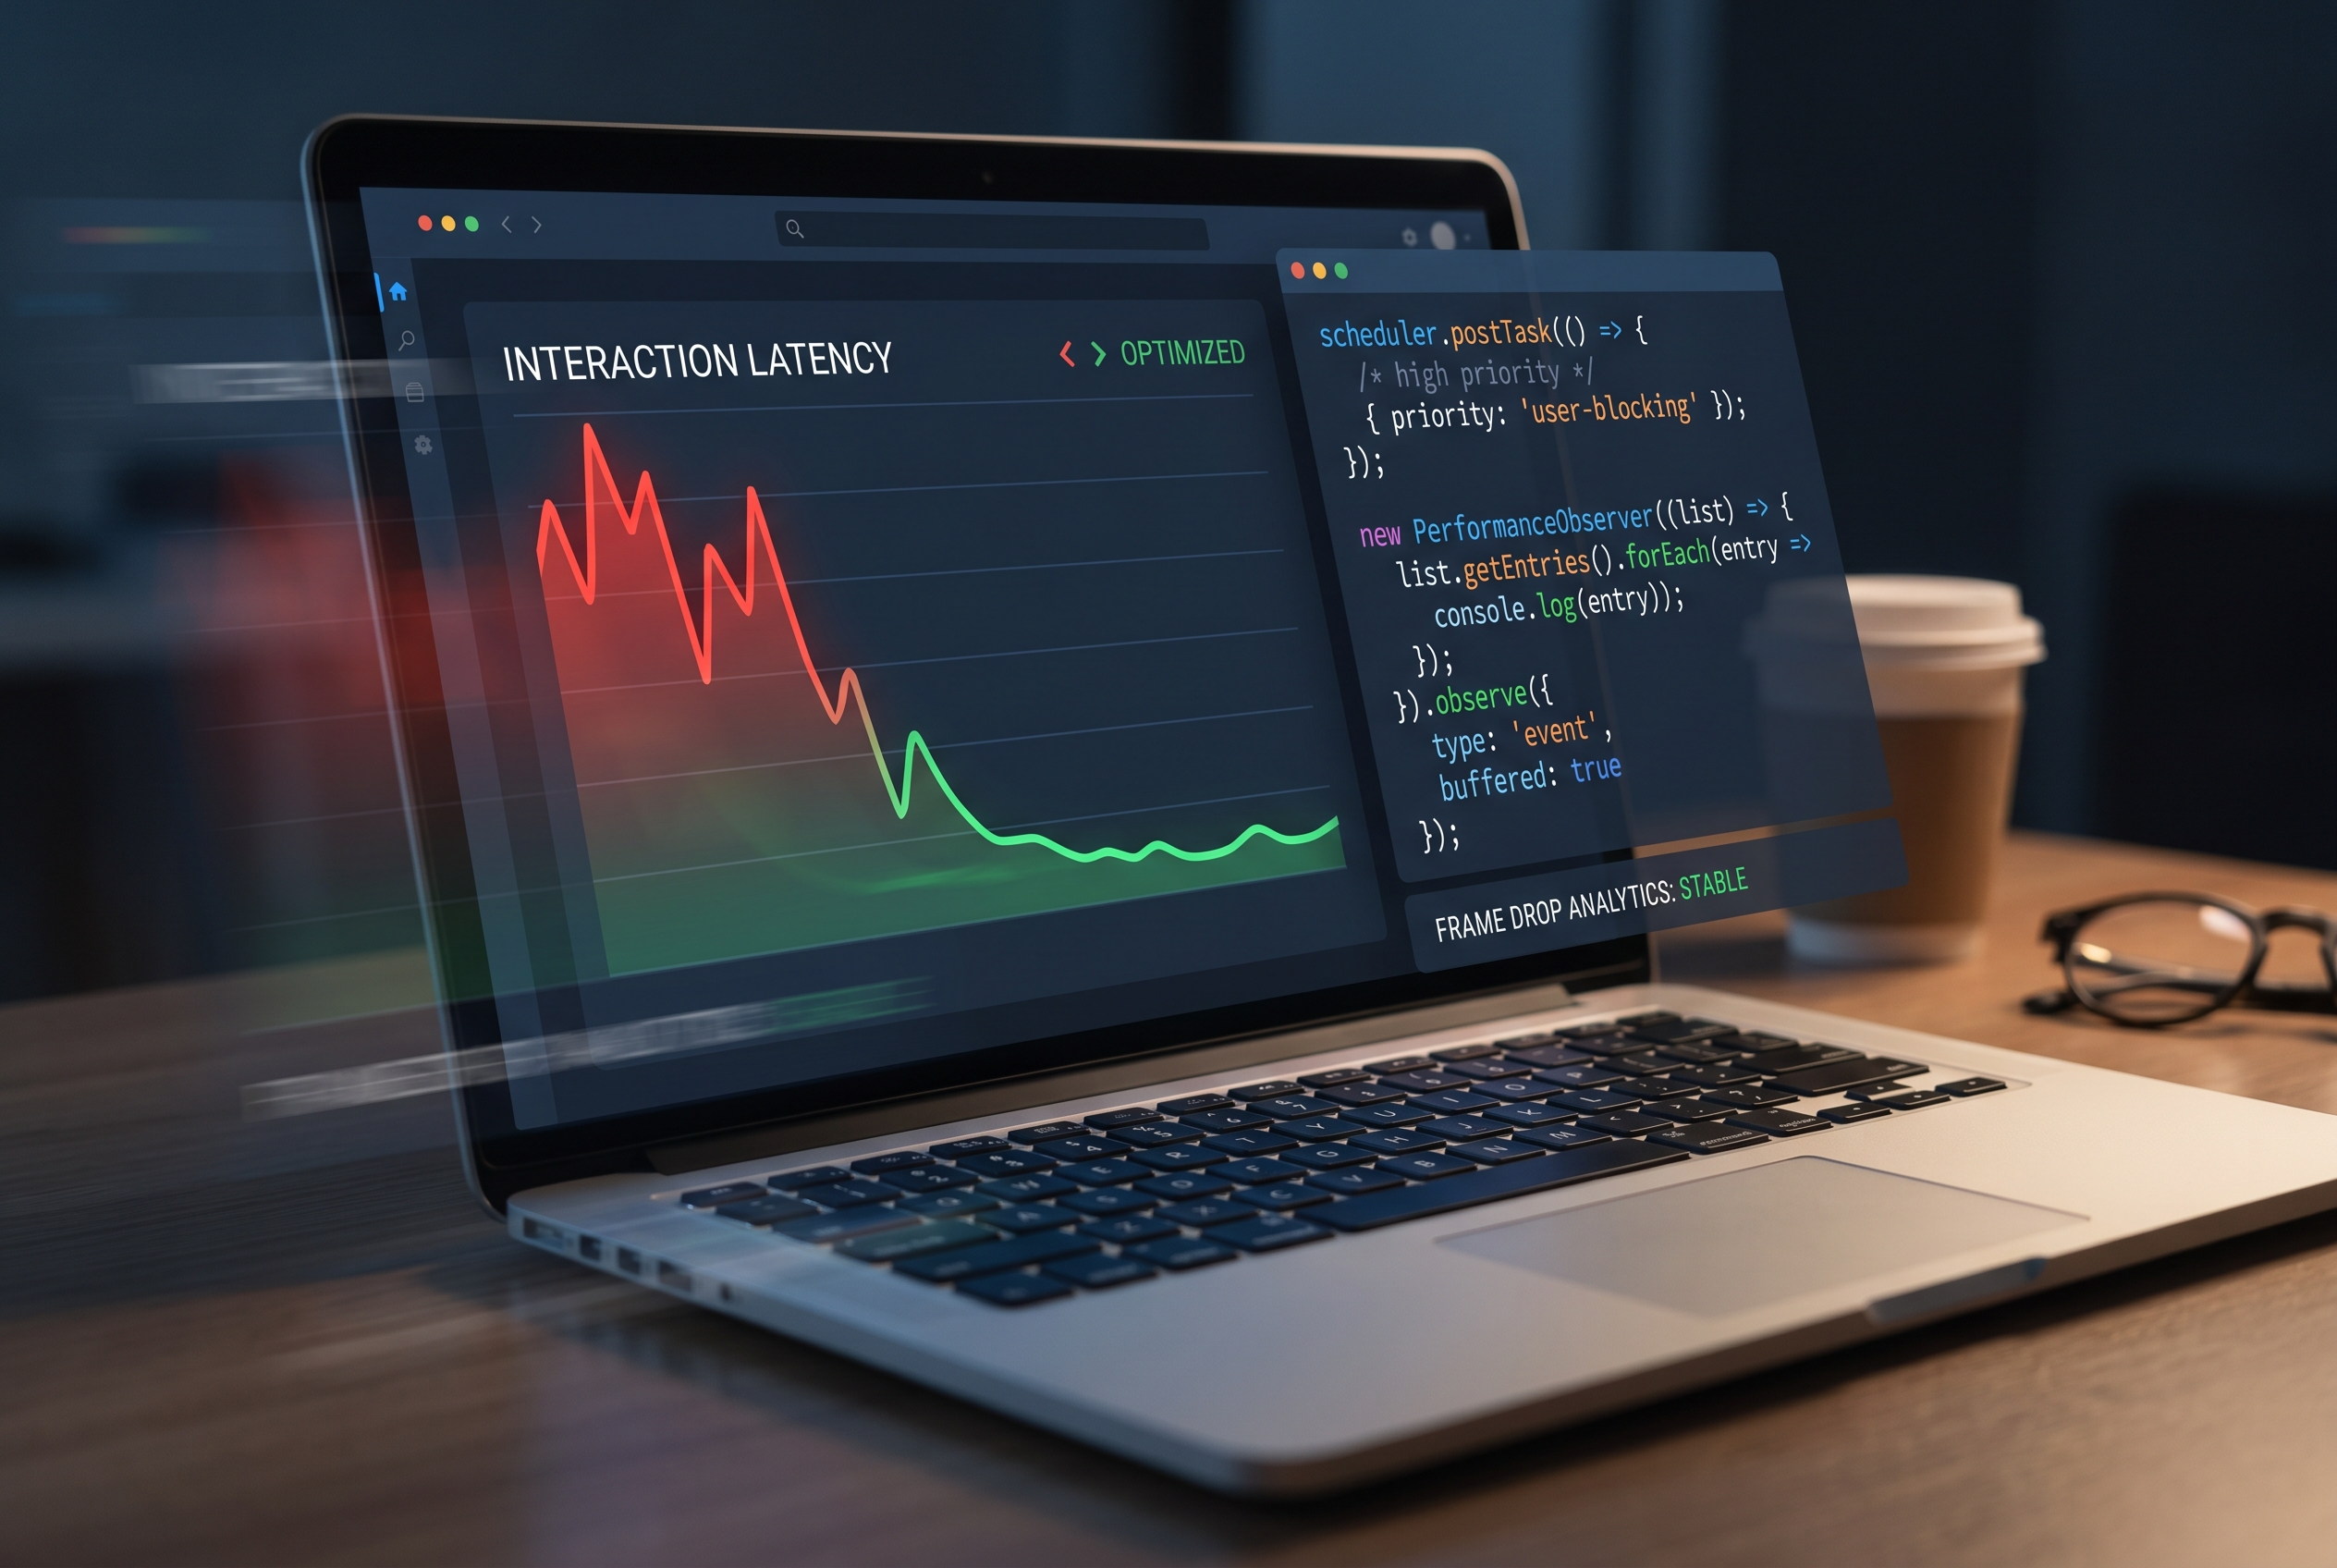
That is the kind of bug you only understand when you treat responsiveness as a product feature, not a side effect. In this post, I will walk through the exact JavaScript INP optimization approach we used to recover interaction trust: measuring the right interactions, setting a main-thread budget, and using scheduler.postTask() plus safe fallbacks to keep UI feedback fast.
If you are already tuning React rendering paths, keep this guide next to our React performance playbook. If your bottleneck is hidden in request timing or stale content behavior, pair it with our HTTP caching guide. And if your frontend waits on slow service responses, our Node.js systems article helps close that loop.
The metric that matched what users were feeling
We stopped debating opinions and looked at INP (Interaction to Next Paint). As of the Core Web Vitals direction, a good INP is 200ms or less at the 75th percentile. In our case, mobile p75 was around 380ms on the most-used screen, with occasional spikes above 700ms during heavy filter changes.
Important nuance: INP is not “backend complete time.” It is the delay until the next visual paint after interaction starts. If you fail to show immediate visual feedback, users interpret that as failure even when your API eventually succeeds.
How we found the real offenders (not the loudest guesses)
Our first impulse was to blame network calls. Wrong. We had several interactions where API latency was normal, but the main thread was busy serializing a large client-side payload, formatting table rows, and dispatching analytics in the same click handler.
We instrumented two things in production RUM:
- Interaction-level timing via
web-vitalsINP attribution. - Long tasks via
PerformanceObserveronlongtaskentries.
import { onINP } from 'web-vitals/attribution';

// 1) Capture worst interactions with element + event context.
onINP((metric) => {
  sendToRum('inp', {
    value: metric.value,
    rating: metric.rating,          // good / needs-improvement / poor
    interactionTarget: metric.attribution?.interactionTarget,
    interactionType: metric.attribution?.interactionType,
    loadState: metric.attribution?.loadState,
    url: location.pathname,
    ts: Date.now(),
  });
});

// 2) Capture long tasks that correlate with click lag.
if ('PerformanceObserver' in window) {
  const po = new PerformanceObserver((list) => {
    for (const entry of list.getEntries()) {
      sendToRum('longtask', {
        start: entry.startTime,
        duration: entry.duration,
        name: entry.name,
        // Attribution is not always populated across browsers.
        attribution: entry.attribution?.map((a) => ({
          containerName: a.containerName,
          containerSrc: a.containerSrc,
        })) ?? [],
      });
    }
  });

  po.observe({ type: 'longtask', buffered: true });
}
Within 24 hours, we saw a pattern: the worst interactions clustered around one handler that mixed user-visible and background work in the same task.
The main-thread budget that actually worked
We introduced a simple rule in code review:
- Interaction-critical task budget: 100ms on typical desktop, lower target on mobile.
- Never batch analytics, heavy serialization, and DOM-heavy updates inside the same first interaction task.
This was less about magic numbers and more about forcing sequencing discipline. We split work into three lanes:
- Immediate UI feedback (sync, first paint friendly): disable button, show spinner/toast, optimistic state.
- User-visible follow-up (high priority): render data users need right now.
- Background work (lower priority): analytics, noncritical prefetch, secondary formatting.
Using scheduler.postTask() safely (with fallback)
scheduler.postTask() gave us cleaner priority control than chaining setTimeout(..., 0) everywhere. We still ship a fallback for browsers without scheduler support.
function postBackgroundTask(task) {
  if (globalThis.scheduler?.postTask) {
    return scheduler.postTask(task, { priority: 'background' });
  }

  // Fallback: still split task, but without priority semantics.
  return new Promise((resolve, reject) => {
    setTimeout(() => {
      try {
        resolve(task());
      } catch (err) {
        reject(err);
      }
    }, 0);
  });
}

async function onSaveDraftClick(payload) {
  // 1) Immediate visual feedback for quick next paint.
  setSavingState(true);
  showToast('Saving draft...');

  // 2) Keep interaction path lean.
  const response = await api.saveDraft(payload.minimalForm);
  applyServerPatch(response);

  // 3) Defer expensive but noncritical work.
  await postBackgroundTask(() => {
    cacheLargeDerivedModel(payload.fullForm);   // heavy serialization
    emitAnalytics('draft_saved', {
      size: payload.fullForm.items.length,
      route: location.pathname,
    });
  });

  setSavingState(false);
}
Tradeoff to acknowledge: pushing too much work into background tasks can improve perceived responsiveness while delaying eventual consistency for secondary UI details. We handled this by explicitly marking secondary elements as “updating” so users were never misled.
What changed after rollout
After shipping the split-task approach on the top two interaction surfaces:
- Mobile p75 INP dropped from ~380ms to ~210ms in a week.
- “Double-click” behavior in session replays reduced sharply.
- Support tickets about “stuck save” declined without backend changes.
Notice what we did not claim: that one API solved everything. Some gains came from deleting unnecessary state transforms and tightening rendering paths. The scheduler helped, but clean interaction boundaries did most of the heavy lifting.
If you are standardizing reliability end-to-end, this frontend work pairs well with CI policy gates from our DevOps automation pipeline guide.
Troubleshooting: when INP does not improve even after splitting tasks
1) “We split work, but INP is still poor on mobile”
Check if large style/layout recalculations happen right after your interaction. A lighter JS handler can still trigger expensive synchronous layout work. Profile with Performance panel and watch rendering cost, not just script time.
2) “Our fallback path behaves differently than scheduler.postTask”
That is expected. setTimeout fallback does not provide the same priority semantics. Treat fallback as compatibility, not equivalence. Validate UX on low-end devices where queue contention is worst.
3) “INP got better, but users still say it feels laggy”
Look at interaction design. If no immediate visual acknowledgment appears, people perceive delay. Add deterministic feedback in under one frame: button state, progress hint, or optimistic UI marker.
FAQ
Q1: Should I optimize for INP even if Lighthouse looks fine?
Yes. Lighthouse lab runs are useful, but INP is strongest with field data from real devices and real interaction paths. Treat lab as debugging support, not final truth.
Q2: Is scheduler.postTask() a replacement for Web Workers?
No. It helps prioritize tasks on the main thread. For CPU-heavy transforms that can be isolated, Web Workers remain the better architectural move.
Q3: Do I need to rewrite my whole frontend architecture to improve INP?
Usually not. Start by instrumenting worst interactions, split mixed-priority handlers, and remove waste in the interaction path. Most teams see meaningful gains before major rewrites.
Actionable takeaways you can apply this week
- Track INP in field data at p75 by device class, then map bad interactions to specific handlers.
- Set a main-thread budget for interaction-critical code and enforce it in reviews.
- Split immediate feedback, user-visible updates, and background tasks into separate execution lanes.
- Use
scheduler.postTask()where supported, with explicit fallback behavior. - Treat responsiveness as user trust: a fast first paint after click is often more important than total workflow completion time.
Primary keyword: JavaScript INP optimization
Secondary keywords: PerformanceObserver long tasks, scheduler.postTask, main thread performance budget
Leave a Reply