At 2:17 a.m. on a Tuesday, one of our checkout services started doing the weirdest thing. CPU stayed calm, error rate stayed low, and dashboards looked almost healthy, but pod restarts kept climbing. Every restart bought us 20 to 30 minutes, then memory climbed again until the container hit its limit and died. If you have ever handled this kind of incident, you know the feeling: no smoking gun, only a slow leak and a tired team.
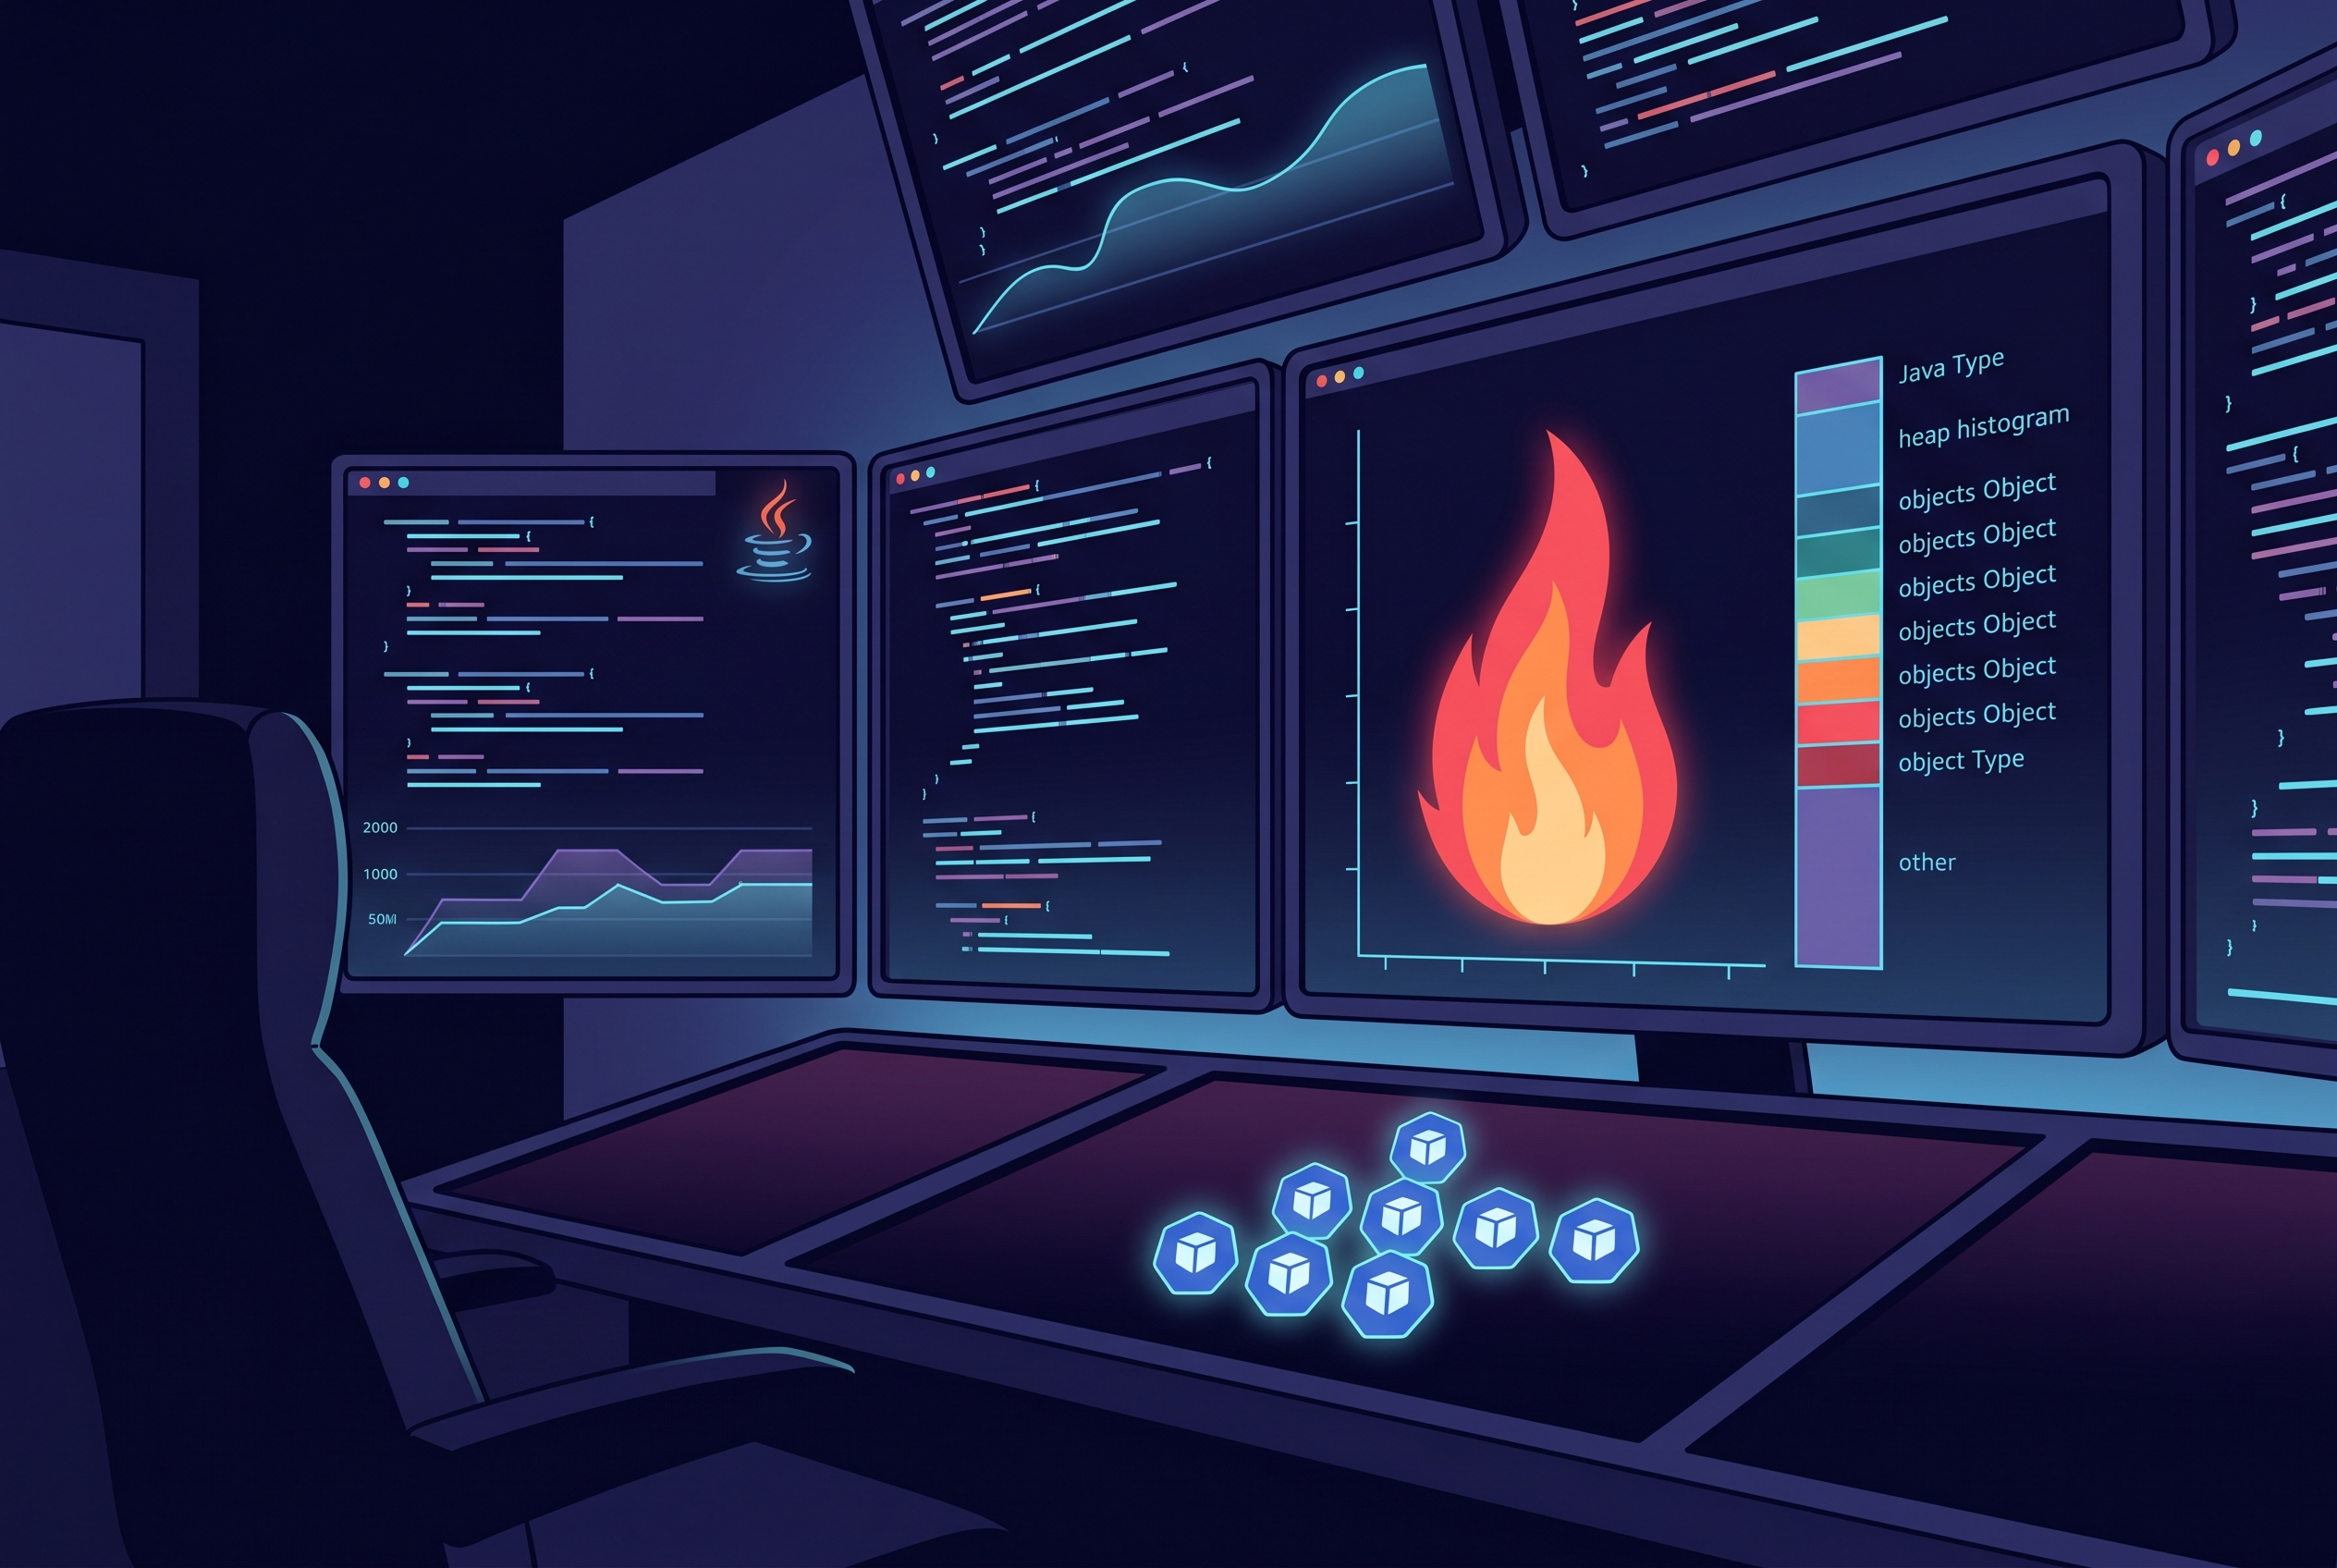
This guide is a practical Java memory leak troubleshooting runbook for production teams. It combines Java Flight Recorder, heap histograms, and an async-profiler flame graph, plus safe Kubernetes ephemeral container debugging when your base image is minimal.
If your team is also hardening event-driven Java services, my earlier post on Java Kafka consumer reliability pairs well with this workflow.
Why leak incidents are harder in 2026 production stacks
Modern Java services are usually deployed with tight memory limits, autoscaling, and slim container images. That setup is great for cost and rollout speed, but it makes debugging harder:
- You might not have shell tools in the running image.
- OOM kills can happen before full dumps finish writing.
- Low-latency services cannot tolerate heavy profiling overhead.
Tradeoff: collecting rich diagnostics during peak traffic can increase overhead. Collecting too little leaves you guessing. The trick is to gather enough evidence in short, controlled windows.
A leak-triage loop that works under pressure
1) Confirm this is a leak, not bursty traffic
Before grabbing profiles, confirm the memory trend survives traffic normalization. Compare heap usage after each GC cycle, not just raw RSS. If post-GC baseline keeps stepping upward over multiple intervals, suspect a leak or unbounded cache growth.
2) Collect low-overhead evidence first (JFR + class histogram)
Oracle recommends using jcmd as the primary modern diagnostic CLI, and JFR is designed for production-time collection with low overhead. Start there first, then escalate only if needed.
# inside the target container or debug container
PID=$(jcmd | awk '/org.springframework.boot.loader.JarLauncher/ {print $1; exit}')

# 10-minute profiling recording with production-safe defaults
jcmd "$PID" JFR.start name=leak_triage settings=profile duration=10m filename=/tmp/leak_triage.jfr

# quick object distribution snapshot
jcmd "$PID" GC.class_histogram > /tmp/class_histogram_before.txt
sleep 300
jcmd "$PID" GC.class_histogram > /tmp/class_histogram_after.txt
What you are looking for:
- classes that keep growing between snapshots (for example
byte[],HashMap$Node, or framework-specific wrappers), - allocation hotspots in JFR that match those classes,
- thread or lock patterns that suggest backlog, not classic leakage.
3) Use async-profiler for sharper allocation context
When JFR points to a broad hotspot, async-profiler helps isolate call paths with much better stack clarity, including native frames. It is especially useful when leaks are really allocation storms from retries, serialization, or accidental object retention.
# 60-second allocation profile
asprof -e alloc -d 60 -f /tmp/alloc.html "$PID"

# optional CPU sample to correlate allocator pressure with hot methods
asprof -e cpu -d 30 -f /tmp/cpu.html "$PID"
Tradeoff: async-profiler is still lightweight, but container security settings can block perf events. If that happens, switch to documented alternatives such as adjusted seccomp/capabilities, fdtransfer mode, or timer-based fallback where appropriate.
4) If container is minimal, debug via ephemeral container
Kubernetes debugging docs recommend layered inspection: describe, events, logs, then deeper access. For locked-down images, add a temporary debug container in the same pod namespace, collect artifacts, and remove it once done.
# attach a temporary debug container without rebuilding app image
kubectl debug -n payments pod/payments-api-7b8d9 --target=app \
  --image=ubuntu:24.04 -it

# from there, inspect pod state and copy artifacts out
kubectl describe pod payments-api-7b8d9 -n payments
kubectl cp payments/payments-api-7b8d9:/tmp/leak_triage.jfr ./leak_triage.jfr
If your platform team is tightening Kubernetes policy, this complements our admission-control runbook on Pod Security, CEL, and Gatekeeper guardrails.
The pattern we actually found in one real incident class
In our case, the leak was not a classic forgotten collection. It was a retry fan-out bug:
- downstream latency rose,
- retry logic duplicated in two layers,
- in-flight payloads accumulated in a request-scoped cache map that was never bounded.
JFR showed growing allocation pressure around JSON buffers. Histogram deltas showed fast growth in byte[] and map entries. async-profiler connected both to a specific retry wrapper path. Without all three views, each signal alone looked ambiguous.
Code-level fixes that reduce leak risk
These changes are boring but effective.
// bounded cache + explicit expiry
var cache = Caffeine.newBuilder()
    .maximumSize(10_000)
    .expireAfterWrite(Duration.ofMinutes(5))
    .recordStats()
    .build();

// one retry layer only, with strict attempt budget
Retry retry = Retry.of("downstream", RetryConfig.custom()
    .maxAttempts(3)
    .waitDuration(Duration.ofMillis(200))
    .retryOnException(ex -> ex instanceof TimeoutException)
    .build());

Supplier<Response> guarded = Retry.decorateSupplier(retry, this::callDownstream);
- Bound every cache unless you can prove cardinality is fixed.
- Keep retry ownership in one layer, not in controller + client + SDK simultaneously.
- Export cache and queue depth metrics so memory growth is visible before OOM.
If you are improving reliability standards across stacks, this aligns with our broader backend reliability intent-debt framework and event-driven service operations guide.
Troubleshooting: common failure modes during leak triage
Problem 1: JFR file is missing after recording command
Likely causes: wrong PID, path not writable, or container restarted before dump completed.
Fix: verify PID with jcmd, write to a writable mount, shorten duration, and copy artifacts immediately.
Problem 2: async-profiler says perf events are not permitted
Likely causes: seccomp profile blocks perf_event_open or missing capabilities.
Fix: follow async-profiler container guidance, coordinate with platform security, or use supported fallback sampling modes.
Problem 3: Heap dump is too heavy for incident window
Likely causes: large heap under load, slow disk, strict resource limits.
Fix: prefer histogram deltas + JFR first. Take full heap dump only when you can afford pause/IO impact.
Problem 4: Memory grows but no obvious dominant class
Likely causes: fragmented growth across many small objects or off-heap pressure.
Fix: correlate GC logs, native memory tracking, and allocator profiles. Do not assume heap-only leak by default.
FAQ
1) Is JFR safe to run in production during peak traffic?
Usually yes with conservative settings and short windows. Oracle positions JFR as low-overhead, but your overhead depends on enabled events and duration. Start narrow, then expand if needed.
2) Should I start with heap dump or sampling profile?
Start with sampling and histogram deltas. They are faster and lower risk during active incidents. Use heap dumps when you need object-retention proof and can handle the operational cost.
3) Can Kubernetes ephemeral debug containers violate security policy?
They can if policy is loose. Treat debug container access as privileged operational tooling: time-box it, audit it, and align with admission and RBAC controls.
Actionable takeaways
- Adopt a standard Java memory leak troubleshooting runbook: JFR first, histogram delta second, async-profiler third.
- Pre-approve one production-safe profiling path so responders do not negotiate tooling at 2 a.m.
- Instrument bounded caches and in-flight queues, and alert on post-GC baseline drift, not just peak memory.
- Document Kubernetes ephemeral container debugging policy before the next incident.
- Review retry ownership in each service to prevent hidden allocation amplification.
Primary keyword: Java memory leak troubleshooting
Secondary keywords: Java Flight Recorder, async-profiler flame graph, Kubernetes ephemeral container debugging
Leave a Reply