If your React app feels “fast enough” but users still report random slowness, white screens, or hard-to-reproduce crashes, you do not have a rendering problem, you have an observability gap. In 2026, frontend reliability is an SEO and revenue issue, not just a developer-experience issue. In this guide, you will build a production-ready React frontend observability layer using Web Vitals, OpenTelemetry, and Sentry source maps so you can trace user pain from browser interaction to backend span in minutes.
Why React frontend observability matters now
Most teams already monitor API uptime and server CPU, but many still ship React apps with limited visibility into client-side behavior. Real users experience layout shift, hydration mismatches, stalled route transitions, and third-party script regressions long before backend alerts fire.
A complete frontend observability setup should answer four questions:
- How fast does the app feel for real users, on real devices?
- Which route, component, or interaction causes slowdowns?
- Can we connect a frontend issue to backend traces and logs?
- Can we debug minified production errors quickly?
If you already run OpenTelemetry in backend services, this becomes even more powerful. For example, our ASP.NET Core OpenTelemetry setup pairs nicely with frontend spans for full request flow visibility.
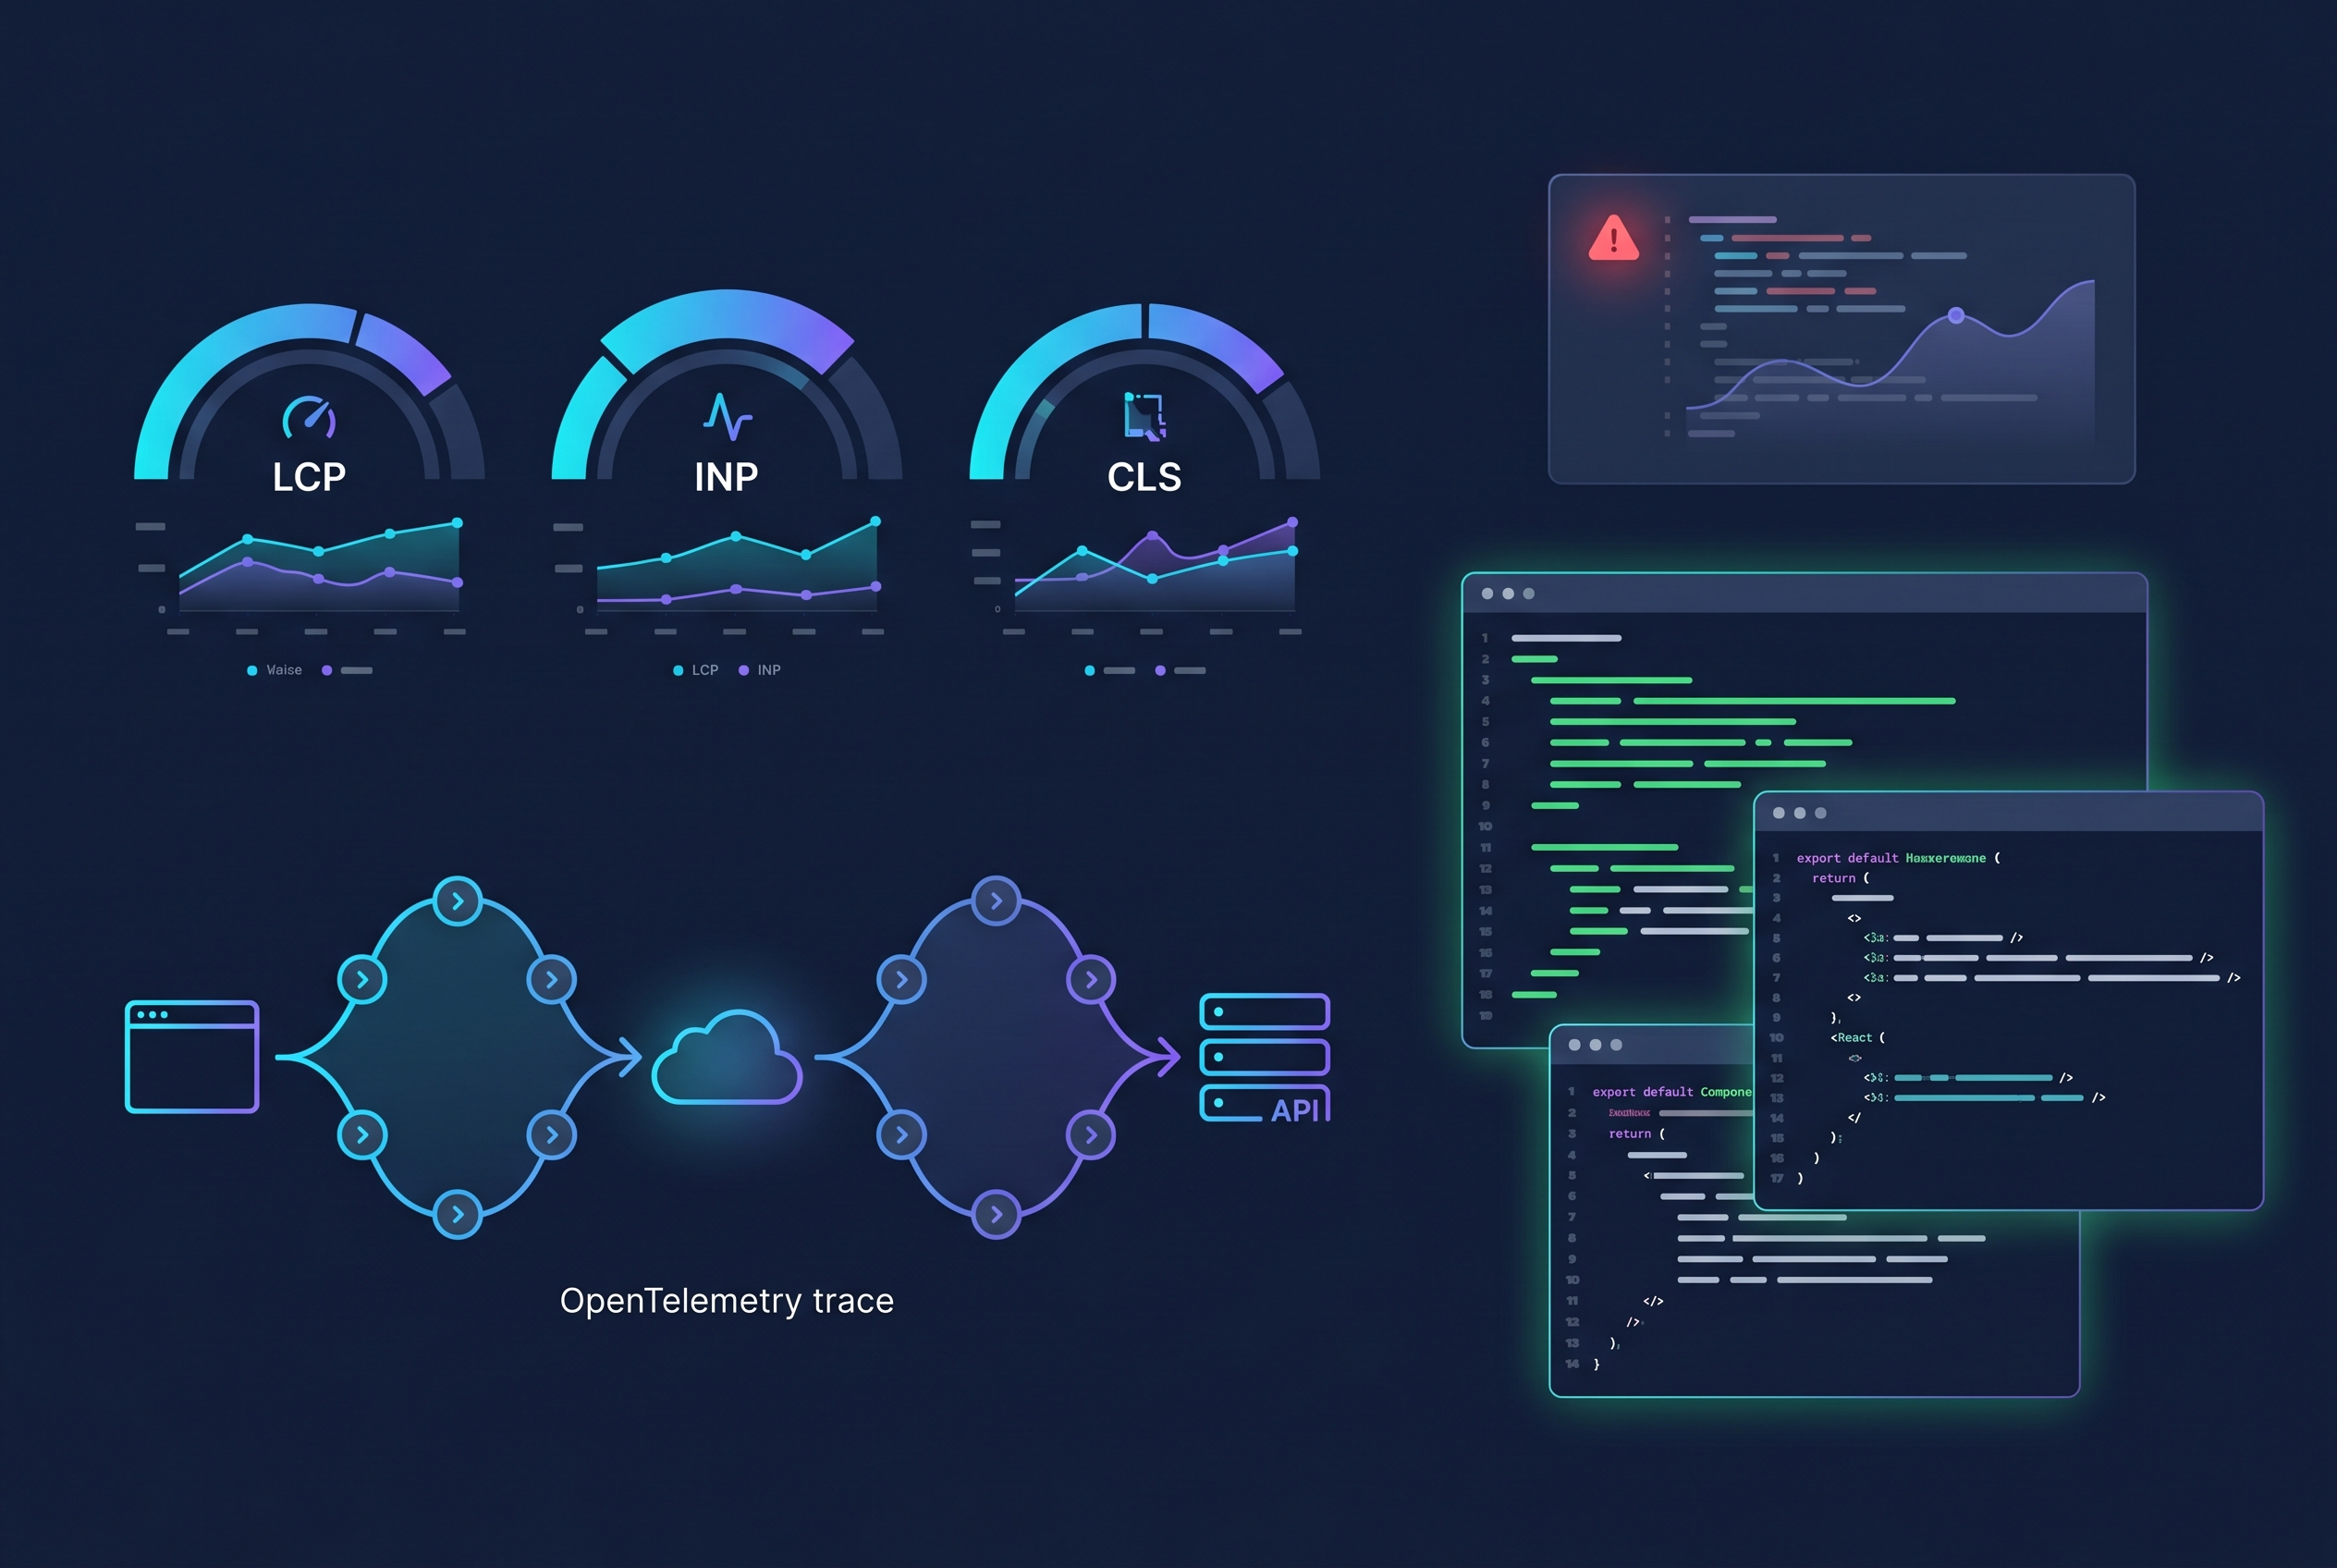
Architecture: Web Vitals + OpenTelemetry + Sentry
Data flow
- React app captures Web Vitals and route/interactions.
- OpenTelemetry browser SDK creates traces and exports to your collector/APM.
- Sentry captures uncaught errors, session context, and source-mapped stack traces.
- Trace IDs are attached to API calls so frontend and backend events can be correlated.
This gives you an end-to-end timeline from user click to API response. It is the same reliability mindset used in resilient systems like this idempotent Node.js webhook pipeline.
Step 1: Instrument Web Vitals in React
Install the metrics package and report values with route and release metadata.
npm install web-vitals
// src/observability/webVitals.ts
import { onCLS, onINP, onLCP, onTTFB, onFCP, Metric } from 'web-vitals';

type VitalEvent = {
  name: string;
  value: number;
  rating?: string;
  route: string;
  release: string;
  ts: number;
};

const sendVital = (metric: Metric) => {
  const payload: VitalEvent = {
    name: metric.name,
    value: metric.value,
    rating: metric.rating,
    route: window.location.pathname,
    release: (window as any).__APP_RELEASE__ || 'dev',
    ts: Date.now()
  };

  navigator.sendBeacon('/rum/vitals', JSON.stringify(payload));
};

export function initWebVitals() {
  onCLS(sendVital);
  onINP(sendVital);
  onLCP(sendVital);
  onTTFB(sendVital);
  onFCP(sendVital);
}
Call initWebVitals() once at app startup. Store metrics by route, device class, and release version so regressions are obvious after deployment.
Step 2: Add OpenTelemetry browser tracing
Now create spans for page loads, route transitions, and fetch/XHR requests. This is where your frontend observability becomes actionable.
npm install @opentelemetry/api @opentelemetry/sdk-trace-web @opentelemetry/context-zone @opentelemetry/instrumentation @opentelemetry/instrumentation-fetch @opentelemetry/instrumentation-xml-http-request
// src/observability/tracing.ts
import { WebTracerProvider } from '@opentelemetry/sdk-trace-web';
import { BatchSpanProcessor } from '@opentelemetry/sdk-trace-base';
import { ZoneContextManager } from '@opentelemetry/context-zone';
import { registerInstrumentations } from '@opentelemetry/instrumentation';
import { FetchInstrumentation } from '@opentelemetry/instrumentation-fetch';
import { XMLHttpRequestInstrumentation } from '@opentelemetry/instrumentation-xml-http-request';

class HttpJsonSpanExporter {
  export(spans: any[], resultCallback: any) {
    fetch('/otel/v1/traces', {
      method: 'POST',
      headers: { 'Content-Type': 'application/json' },
      body: JSON.stringify(spans)
    })
      .then(() => resultCallback({ code: 0 }))
      .catch(() => resultCallback({ code: 1 }));
  }
  shutdown() { return Promise.resolve(); }
}

export function initTracing() {
  const provider = new WebTracerProvider({
    resource: { attributes: { 'service.name': '7tech-react-web' } } as any
  });

  provider.addSpanProcessor(new BatchSpanProcessor(new HttpJsonSpanExporter()));
  provider.register({ contextManager: new ZoneContextManager() });

  registerInstrumentations({
    instrumentations: [
      new FetchInstrumentation({
        propagateTraceHeaderCorsUrls: [/https:\/\/www\.7tech\.co\.in/]
      }),
      new XMLHttpRequestInstrumentation()
    ]
  });
}
Connect this with backend trace collection in your cloud stack. If you are running private internal APIs, this pattern aligns with hardened API topologies like Zero-Trust internal API platforms on AWS.
Step 3: Production-grade error monitoring with source maps
Traces show latency, but error tooling explains failure. Configure Sentry with release tags and upload source maps during CI so stack traces map directly to your TypeScript files.
- Set
releasefrom your Git SHA. - Enable environment tags (
prod,staging). - Upload source maps as part of build pipeline.
- Attach current trace ID to captured exceptions.
This keeps triage fast, similar to disciplined delivery pipelines used in trusted Docker CI workflows.
Step 4: Create actionable alerts and SLOs
Do not alert on every spike. Alert on user-impact thresholds tied to business experience:
- P95 INP > 200ms for checkout route for 10 minutes
- LCP regression > 20% after a new release
- JavaScript error rate > 1% for authenticated sessions
- Route transition span > 1.5s on low-end Android devices
Track these per release to catch bad deploys early. If your app includes auth-heavy UX, combine this with secure modern login flows like passkey-first WebAuthn implementation to reduce both failures and support load.
Common implementation mistakes
1) Capturing metrics but not metadata
Without release, route, and device tags, you cannot isolate regressions.
2) No sampling strategy
Tracing everything increases cost quickly. Start with 10-20% sampling and raise for critical paths.
3) Ignoring ad/script impact
Third-party scripts can dominate INP and CLS. Segment metrics by page type and script presence.
4) Treating frontend and backend as separate worlds
Frontend span context should flow into API requests. Correlated traces are where root-cause speed comes from.
Final checklist
- Web Vitals recorded for key routes
- OpenTelemetry spans exported with trace propagation
- Error monitoring with source maps and release tags
- SLO-based alerts tied to real user pain
- Regression review added to every deployment
Once this baseline is live, React performance discussions become data-driven. You stop debating “feels slow” and start fixing specific routes, components, and releases with confidence.
FAQ
What is the best primary metric for React UX in 2026?
INP is usually the strongest interaction quality signal, but do not use it alone. Pair INP with LCP and JavaScript error rate for balanced coverage.
Can I use OpenTelemetry without a full APM platform?
Yes. You can export traces to your own collector and store selected span data in logs or analytics systems. APM just speeds up visualization.
How often should source maps be uploaded?
On every production build. Source maps must match the exact deployed artifact and release ID, otherwise stack traces become misleading.
Will this hurt frontend performance?
If configured correctly, overhead is low. Use batching, adaptive sampling, and minimal payload metadata to keep monitoring lightweight.
Leave a Reply